7 Key Business Metrics You Should Be Tracking
A healthy business can’t run off of intuition and passion alone. While you likely started a business to share what you love with a larger community, without monitoring business metrics you’ll find challenges in reaching your goals or finding the next level of growth.
Being a successful business owner often means being an expert at analyzing key metrics and reacting to them. That may sound intimidating, but once you know what to look for it’s like creating your own secret sauce. You know the key ingredients that make it successful and where you should apply it to boost your business.
What Are Key Performance Indicators?
From knowing you’re ready to expand into a new market to identifying what products need a new strategy, tracking your performance requires a holistic approach.
Important business metrics, otherwise referred to as key performance indicators (KPIs), tell the story of your business through sales, marketing, and inventory data points.
Your results aren’t simply “good to know.” It’s equally as important to use your findings to implement new strategies and track your success.
However, it’s essential not to let a small dip in performance drive fast and temporary decisions. You should approach your findings as an opportunity to strengthen your long-term plan, rather than bumping sales in the present using strategies that don’t align with your business.
Benefits to monitoring business metrics
- Set attainable business goals using historical data that identifies where there is room for improvement
- Ensure your resources, time, and money are being spent in the right places
- Set a strategy to grow your new business from startup to maturity
- Visibility into your store’s performance and have the opportunity to react in real-time
- Have the data to backup large financial decisions, such as opening a second location or expanding into wholesale
Types of customer engagement
While profit metrics are usually the easiest to see, there are a number of other figures you should consider that also contribute to your business.
The following are all indications that you are successfully reaching customers and leads:
- Growth in product sales, average order values, and reduced returns
- Engage with your marketing material, such as email newsletters, blogs, and social media
- Provide feedback through direct communication or online reviews
- Promote your products or store with referrals
- Participating and hosting events like a summer pop-up shop or holiday party

Top Key Performance Indicators For Every Company
1. Sales revenue
Chances are you look at your sales performance as soon as you pour your first cup of coffee. At a glance, your sales revenue report should provide insight into your store’s performance and output.
Sales income – returned products = sales revenue
Recent market changes, staff shortages, and product selection are all factors that can impact your weekly or monthly revenue.
For instance, if your coffee shop sales drop at the same time as a competing cafe opens a block over, it’s time to set yourself apart. Selling alcohol or carrying local pastries can earn back customers and even attract new ones. By keeping your finger on the pulse, you’re able to take action quickly.
While sales revenue is arguably the most popular business metric, it’s not the only one you should be basing your company’s performance on.
Powerful Sales Insights You're Missing
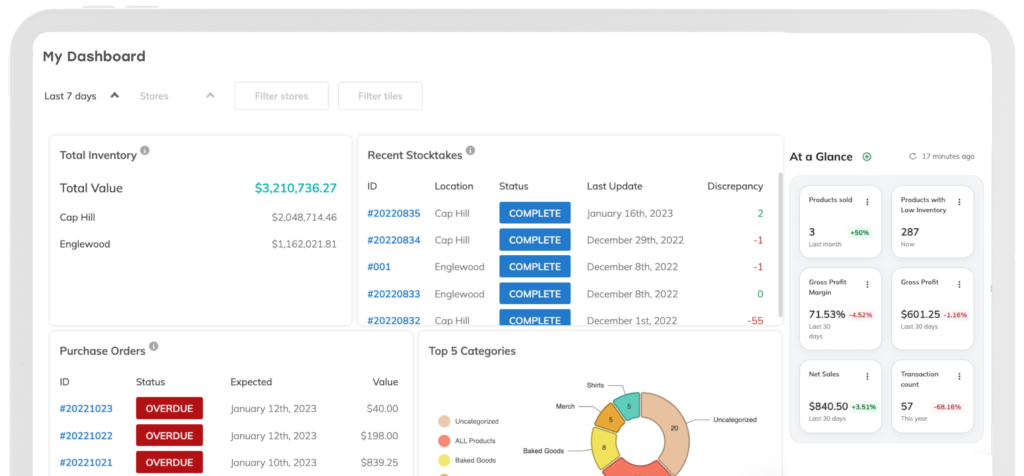
Thrive Inventory’s custom reporting engine tracks your sales revenue in real-time across all your locations and channels. Create monthly sales Goals and compare your progress against your target, so you can see what’s working and what can be improved upon.
2. Revenue growth
Once you have your sales revenue generated, you can report your revenue growth. This is simply calculating your sales performance year-over-year as a percentage. Revenue growth can show if your product assortment strategy or competitive advantage is working on a larger scale which can be hard to see on a weekly basis.
((Current year revenue – prior year revenue) / prior year revenue) *100 = Revenue growth
By comparing your performance last year to the current year you can set attainable goals specific to your business. For instance, a music shop might invest more in Google Shopping Ads to increase online sales by 10% the next year.
3. Gross profit margin
Your company’s gross profit margin determines the total amount of profit you earn from sales. That profit can then be used towards paychecks, rent, and other costs. Your gross profit margin should be translated as a percentage of your sales revenue.
((Total sales revenue – cost of goods sold) / total sales revenue) *100 = Gross profit margin
This business metric is especially important for new locations or businesses. If your margin continues to grow, you’re likely to become more profitable and efficient.

4. Net profit margin
Net profit margin is similar to your gross margin, except it takes into account the average fixed costs of running your business. This includes recurring electricity and marketing expenses. This is good to calculate on a monthly, quarterly, and yearly basis.
Sales revenue – sales expenses = Net profit margin
If your net profit margin isn’t meeting your target, consider ways to increase your sales revenue or cut back on expenses. A boutique may discount slow-moving accessories, making room for more popular ones, or use an inventory management system with built-in reporting and pricing capabilities instead of paying for multiple different apps.
5. Customer acquisition costs
Whether you’re running Google Shopping Ads or sending direct mail, your marketing efforts cost money. Track the success of leads and new customers to see what’s working and what isn’t.
Marketing costs / number of customers acquired = Customer acquisition cost
So what determines a healthy customer acquisition cost? Well, there’s no one size fits all answer. It will depend on your marketing channels, customer lifetime value (the average amount of sales revenue during a specified time range for a single customer), and conversion rate.
Let’s say you spend $1,000 on an in-store event and by the end of the night 27 new customers made purchases. That would make your customer acquisition cost $37. If on average your customer spent $100 per purchase, you have a pretty solid marketing strategy.
You can continue to monitor the lifetime value of those customers and even compare customer acquisition costs between channels. That will help determine what marketing efforts are most successful and ensure you’re reaching the right audience.

6. Customer retention rate
It’s 5 times less expensive to retain customers than to advertise and convert new customers. By identifying your retention rate, you can see how strong your brand loyalty and competitive advantage is.
((Existing amount of customers – number of customers at the start of a specific time period) / number of customers at the start of a specific time period) *100 = Customer retention rate
Opposite of your retention rate is your customer churn rate. If your customer churn percentage is higher than your retention rate, then it’s time to rethink your marketing plan.
Consumer shopping habits aren’t just trending towards convenience, but towards companies they connect with on a personal level. If your shoppers care about sustainability, for example, make sure you’re enacting environmentally friendly strategies. Also, implement a customer loyalty program, like Loyalzoo, that keep them coming back for more.
Focus more on setting your business apart from the competition. Not only will that strengthen brand loyalty, but it will consequently attract new shoppers.
7. Employee satisfaction
This is one key performance indicator many small businesses don’t consider. While you probably have a good feeling if your staff is enjoying their work experience or not, this will identify specific weaknesses.
Simply create a survey to collect feedback about aspects of your company, such as benefits, work environment, job satisfaction, etc. Make sure to have it on a scale to easily quantify your results. Also, encourage your employees to leave color commentary anonymously.
When employee retention and satisfaction are low in the industry, having a happy and stable staff means you can completely focus on your customers.
E-Commerce Key Performance Indicators
Website traffic
Using Google Analytics, you can track traffic and trends for your e-commerce website. We recommend looking at these key metrics:
- New and returning visitors
- Source (organic, social media, referrals, etc)
- Bounce rate
If you have a low percentage of new visitors it might be time to increase your marketing spend on platforms such as Google Shopping Ads. The number of returning visitors is a good indication of high customer satisfaction or churn rate.
Your traffic source shows where your visitors are coming from. This gives you a better understanding of where your target audience spends their time and their where they are in the buying journey. This is a great place to track the success of a marketing campaign. A high influx of traffic from social media means you’re reaching qualified leads who are interested in your products. If your traffic doesn’t budge much, it’s time for a new strategy.
A high bounce rate on product pages shouldn’t necessarily cause a reason to worry. If you have an e-commerce and brick-and-mortar store, that may mean local shoppers are confirming you have the products they need before shopping in store. However, a high bounce rate on an e-commerce only business likely means you’re not targeting the right shoppers, don’t have the right merchandise mix, or aren’t competitive enough.

Conversion rate
Once a shopper lands on your website, the conversion rate calculates the percentage of leads that completed a purchase.
New leads in a specific time period / number of new purchases during that time period = Conversion rate
The average e-commerce conversation rate is between 2% – 3%. A number of factors play into the likelihood to convert, including the target audience, your product assortment, and the customer buying journey. If your conversation rate is lower than what’s expected, take steps such as optimizing your website, A/B testing product titles, and adding reviews.
Cart abandonment
Let’s say a shopper gets to your website, adds a product to their cart, then drops off without completing the purchase. That’s cart abandonment.
(1 – (number of completed purchases / number of initiated sales)) *100 = Cart abandonment rate
A high cart abandonment rate usually doesn’t mean you have bad products or your shoppers aren’t connected with your brand. More often than not, it boils down to convenience and the customer experience.
Here are some of the top reasons for cart abandonment:
- No free shipping or expensive shipping
- Lengthly shipping times
- Additional service and tax costs
- No coupon code
- Slow checkout process
- Confusing user experience
Cart abandonment issues can be a challenge for small business owners to overcome. A lot of times it means working with a website developer or navigating different checkout plugins for your site. Or trying to compete with e-commerce giants Amazon with free, two day shipping.
There are, however, some simple things you can try first. Consider raising the prices on your e-commerce products a bit to offset lowered costs and set clear expectations around the delivery timeline.
As for user experience, ensure your page load times are fast by optimizing images or getting rid of unnecessary script and plugins.
Also, make sure you set up cart abandonment emails as a gentle reminder to shoppers that they left something in their cart. To learn more about setting up abandoned cart emails, check out this guide from klaviyo.
Marketing Performance Metrics
Email open rate
The first step to taking an action on your newsletter or abandoned cart email is to open it. Most email builders, like Mailchimp, will automatically track the percentage of opens on your audience list.
A low open rate isn’t doing you much good. Try testing different subject lines, personalization, and segmentation to improve your marketing efforts.
Email click-through rate
This is the next thing you’ll want to measure is the success of the content inside your email.
Clicks / email opens = Click-through rate
Limiting the number of buttons/links, increasing the incentive, and simple, well-designed emails are all ways to boost your click-through rate.

Social media followers
Not only is social media a free tool, but it’s also an easy way for small businesses to reach potential shoppers and engage with loyal customers.
Increase your following by adding social links to your website and emails, following a customer you or your staff connected with in store, and by keeping your pages up to date.
Social media engagement
It’s not enough to just post a couple of times week, you need to create content your audience wants to engage with.
Post engagements / post impressions = Engagement rate
The more people engage with your content, the more visible it will be across platforms. Publish videos, comment on posts, and share original content.
Additional Business Metrics To Track Your Company's Performance
Total inventory valuation
The products on your shelves or piled up in the corner of your warehouse are your biggest asset. Knowing the value of your stock lets you see the potential revenue you’re sitting on.
This metric is useful in many cases. For instance, as the seasons change a clothing store should look at its inventory valuation for products from the ending season. They then may identify high-stock products they want to promote or discount in a timely fashion before they start showcasing next season’s inventory.
Likewise, total inventory reporting shows where you might have money tied up in excess stock. Consider ways to refresh your product display or transform it into a unique product so you can receive your return on investment.
Power Up
Calculate and unlock the insights of your inventory valuation that lead to smarter business decisions and bigger profits.

Break-even point
Especially important for new businesses or additional locations, your break-even point identifies when your store turns profitable.
Fixed costs / contribution margin (total sales revenue / total variable costs) = Break-even point
For instance, a cupcake shop’s fixed costs might be $420,000 and their contribution margin $30 for the year. They would need to sell at least 14,000 cupcakes to make a profit.
Top 5 categories
Knowing your top-selling product categories ensure you’re maximizing success. Using an inventory and sales reporting platform, such as Thrive Inventory Metrics, view your most popular product categories during a select time period.
Do your top categories align with your product assortment strategy? If not, you might be reaching an under-served audience you can expand upon. Or possibly your customers aren’t connecting with the products you expected them to. In which case, talk to shoppers to identify where you’re missing the mark so you can rethink your next purchase order and increase sales.
Setting achievable goals and optimizing your business starts with tracking key metrics. Thrive Inventory’s powerful reporting capabilities paint a comprehensive picture of your store’s inventory and sales performance. Using data means making smarter decisions specific to your business to further set you apart from the competition.
The Newsletter For Small Businesses
Weekly expert insights, industry trends, and inspiring stories designed to help you run your business with confidence.
The Only Inventory System That Actually Helps You Run A Healthy Business
Thousands of customers all over the world use Thrive Inventory to run a healthy business.
Thrive Inventory gives you control over all your inventory, sales channels, and metrics, allowing you to make the right decisions at the right time.
Keep Reading


The Newsletter For Small Businesses
Weekly expert insights, industry trends, and inspiring stories designed to help you run your business with confidence.
Try Thrive Inventory For Free
Add Thrive Inventory to your business and maximize your potential. With powerful and easy-to-use products, it’s time to take control of
your business and see what you can do with Thrive Inventory.